How Affinity Diagrams Empower Product Managers
As product managers, we often grapple with the challenge of organizing complex information. Here's where Affinity Diagrams come in, offering a powerful visual tool to categorize, prioritize, and extract meaningful insights from data.
What are Affinity Diagrams?
Imagine a whiteboard filled with sticky notes, meticulously organized into groups based on shared themes. That's the essence of an Affinity Diagram. It allows you to visually map connections and patterns within large datasets, helping you gain a deeper understanding of customer feedback, user research, and other vital information.
How Affinity Diagrams Benefit Product Managers:
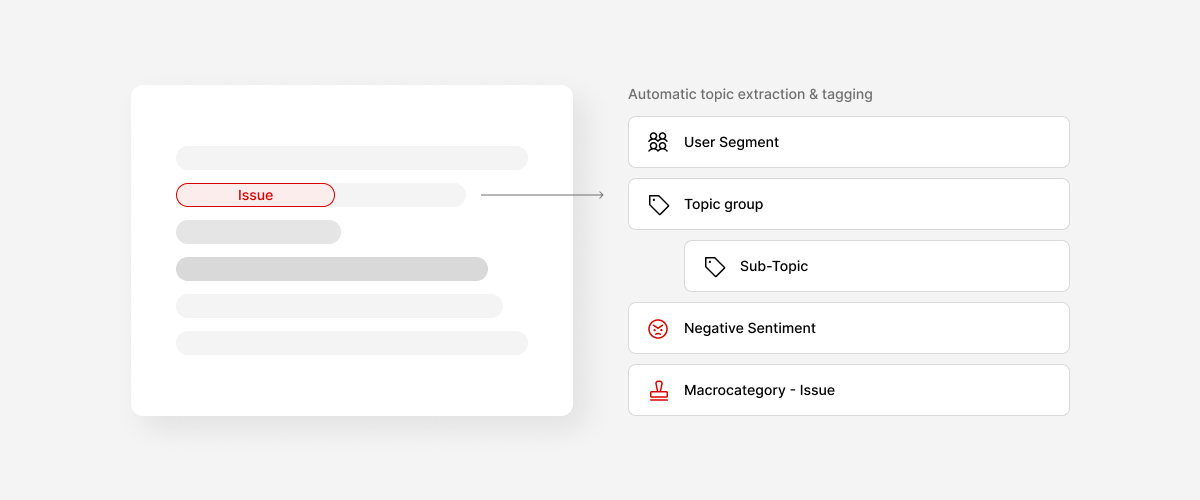
- Unearthing Customer Insights: Group customer feedback into themes like common pain points or desired features. This helps prioritize product development efforts based on real user needs.
- Transforming User Research: Organize findings from user research into key themes and insights, enabling data-driven product decisions.
- Prioritizing Features Strategically: Use Affinity Diagrams to prioritize features based on user needs, business goals, or other relevant criteria, ensuring resources are allocated effectively.
- Facilitating Collaborative Decision-Making: Affinity Diagrams help visualize ideas and insights, fostering group discussions and consensus-building during decision-making processes.
Building Your Affinity Diagram:
- Gather Your Team: Assemble a diverse group of stakeholders, including users, customers, and team members, to contribute their perspectives.
- Define the Focus: Choose a specific product issue or topic to delve into, such as improving a feature or addressing a customer pain point.
- Brainstorm Freely: Encourage everyone to write down their ideas or opinions on sticky notes, fostering creativity and openness. Each note should capture a single idea.
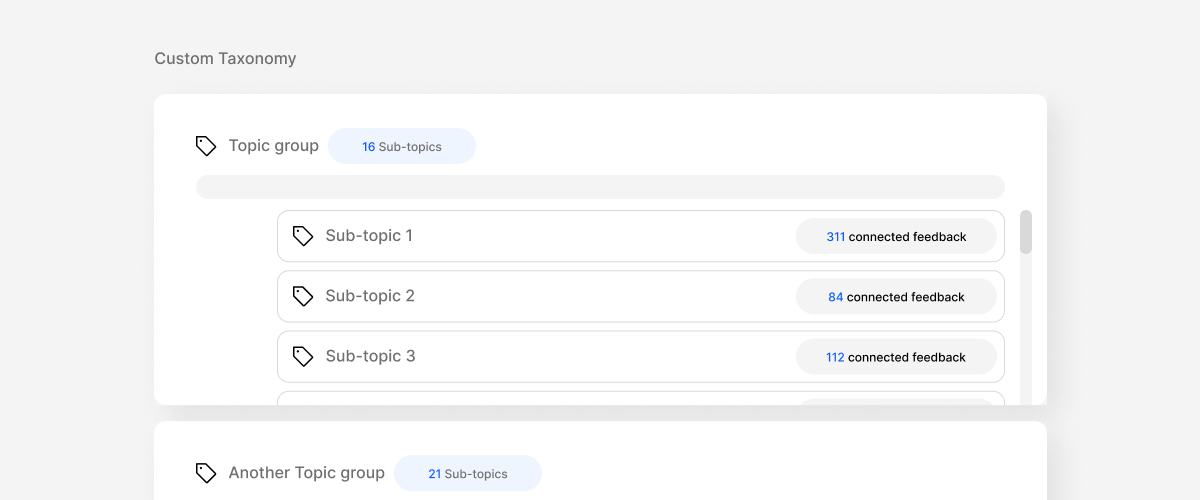
- Uncover Connections: Group the sticky notes based on shared themes or patterns. Move them around until distinct categories emerge.
- Label for Clarity: Assign clear and concise labels to each group, capturing the essence of the common theme it represents.
- Refine and Refine: Look for overlaps or missing connections between groups, and adjust the categories accordingly. This may involve moving notes or creating new groups.
- Extract Meaning: Once your diagram is complete, analyze the groupings and labels to identify insights and patterns. Use these insights to inform product decisions and guide your next steps.
When are Affinity Diagrams Most Valuable?
Throughout the product lifecycle, Affinity Diagrams prove their worth. From aligning stakeholders in early planning stages to analyzing user behavior data, they offer a valuable tool for managing complexity and making informed decisions in the face of multifaceted products.
By leveraging the power of visual representation and collaborative exploration, Affinity Diagrams empower product managers to navigate the intricacies of data and make smarter, user-centric decisions.


